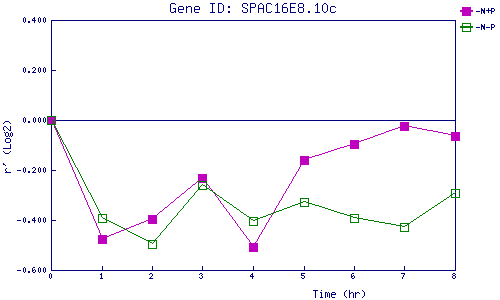
| 0 | 1 | 2 | 3 | 4 | 5 | 6 | 7 | 8 | |
| -N+P | 0.000 | -0.475 | -0.397 | -0.231 | -0.509 | -0.162 | -0.095 | -0.023 | -0.066 |
| -N-P | 0.000 | -0.393 | -0.494 | -0.260 | -0.405 | -0.328 | -0.392 | -0.427 | -0.291 |
|
-N+P: Nitrogen starved in the presence of P-factor -N-P: Nitrogen starved in the absence of P-factor |