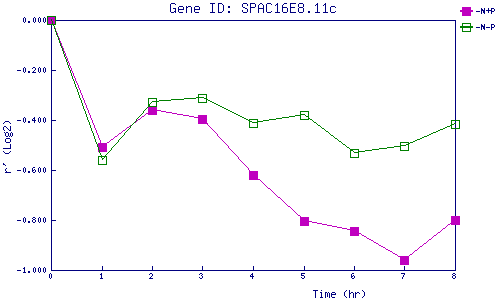
| 0 | 1 | 2 | 3 | 4 | 5 | 6 | 7 | 8 | |
| -N+P | 0.000 | -0.507 | -0.361 | -0.397 | -0.619 | -0.803 | -0.844 | -0.958 | -0.798 |
| -N-P | 0.000 | -0.561 | -0.328 | -0.310 | -0.413 | -0.380 | -0.532 | -0.503 | -0.418 |
|
-N+P: Nitrogen starved in the presence of P-factor -N-P: Nitrogen starved in the absence of P-factor |