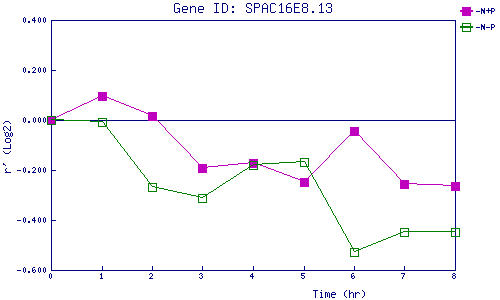
| 0 | 1 | 2 | 3 | 4 | 5 | 6 | 7 | 8 | |
| -N+P | 0.000 | 0.097 | 0.014 | -0.191 | -0.172 | -0.246 | -0.044 | -0.256 | -0.266 |
| -N-P | 0.000 | -0.010 | -0.268 | -0.312 | -0.181 | -0.167 | -0.526 | -0.450 | -0.447 |
|
-N+P: Nitrogen starved in the presence of P-factor -N-P: Nitrogen starved in the absence of P-factor |