| 0 | 1 | 2 | 3 | 4 | 5 | 6 | 7 | 8 | |
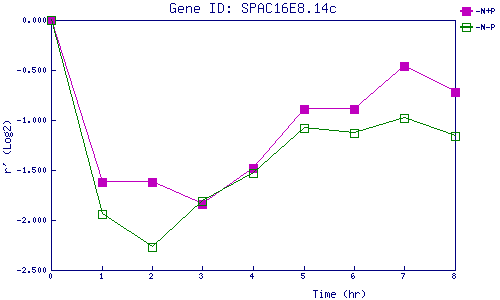
| -N+P | 0.000 | -1.625 | -1.624 | -1.841 | -1.484 | -0.891 | -0.889 | -0.464 | -0.725 |
| -N-P | 0.000 | -1.943 | -2.266 | -1.813 | -1.528 | -1.077 | -1.131 | -0.978 | -1.164 |
|
-N+P: Nitrogen starved in the presence of P-factor -N-P: Nitrogen starved in the absence of P-factor |