tif45 tif1
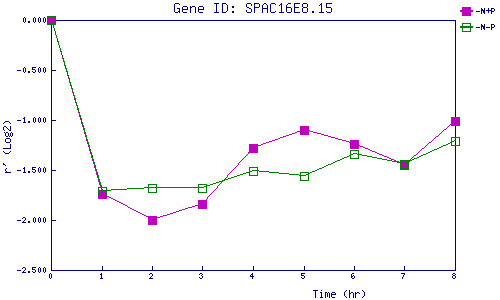
| 0 | 1 | 2 | 3 | 4 | 5 | 6 | 7 | 8 | |
| -N+P | 0.000 | -1.741 | -2.003 | -1.842 | -1.275 | -1.095 | -1.241 | -1.452 | -1.009 |
| -N-P | 0.000 | -1.708 | -1.677 | -1.685 | -1.514 | -1.558 | -1.344 | -1.436 | -1.211 |
|
-N+P: Nitrogen starved in the presence of P-factor -N-P: Nitrogen starved in the absence of P-factor |