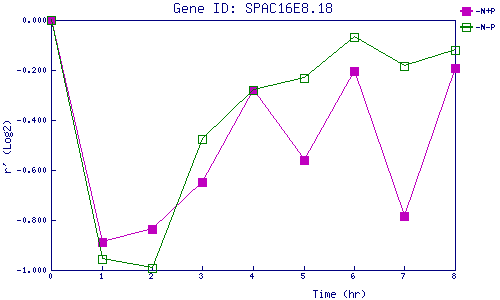
| 0 | 1 | 2 | 3 | 4 | 5 | 6 | 7 | 8 | |
| -N+P | 0.000 | -0.888 | -0.835 | -0.647 | -0.280 | -0.559 | -0.203 | -0.782 | -0.194 |
| -N-P | 0.000 | -0.956 | -0.990 | -0.477 | -0.282 | -0.230 | -0.069 | -0.186 | -0.121 |
|
-N+P: Nitrogen starved in the presence of P-factor -N-P: Nitrogen starved in the absence of P-factor |