| 0 | 1 | 2 | 3 | 4 | 5 | 6 | 7 | 8 | |
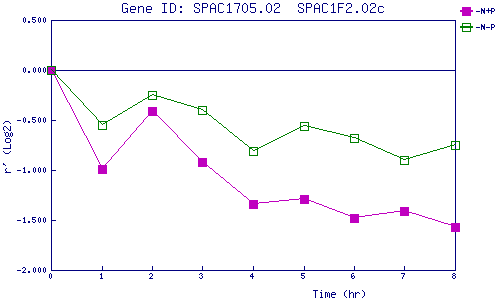
| -N+P | 0.000 | -0.994 | -0.412 | -0.918 | -1.339 | -1.292 | -1.482 | -1.406 | -1.572 |
| -N-P | 0.000 | -0.552 | -0.251 | -0.396 | -0.806 | -0.563 | -0.676 | -0.904 | -0.747 |
|
-N+P: Nitrogen starved in the presence of P-factor -N-P: Nitrogen starved in the absence of P-factor |