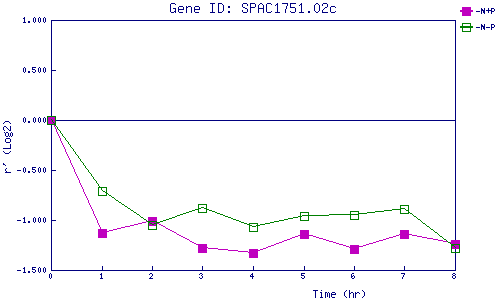
| 0 | 1 | 2 | 3 | 4 | 5 | 6 | 7 | 8 | |
| -N+P | 0.000 | -1.127 | -1.014 | -1.276 | -1.333 | -1.136 | -1.288 | -1.141 | -1.243 |
| -N-P | 0.000 | -0.711 | -1.046 | -0.875 | -1.071 | -0.960 | -0.953 | -0.886 | -1.277 |
|
-N+P: Nitrogen starved in the presence of P-factor -N-P: Nitrogen starved in the absence of P-factor |