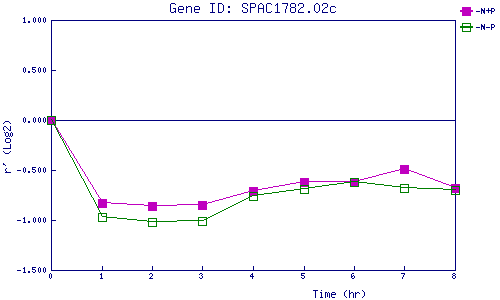
| 0 | 1 | 2 | 3 | 4 | 5 | 6 | 7 | 8 | |
| -N+P | 0.000 | -0.832 | -0.862 | -0.853 | -0.710 | -0.625 | -0.616 | -0.492 | -0.684 |
| -N-P | 0.000 | -0.969 | -1.018 | -1.008 | -0.762 | -0.687 | -0.620 | -0.675 | -0.699 |
|
-N+P: Nitrogen starved in the presence of P-factor -N-P: Nitrogen starved in the absence of P-factor |