| 0 | 1 | 2 | 3 | 4 | 5 | 6 | 7 | 8 | |
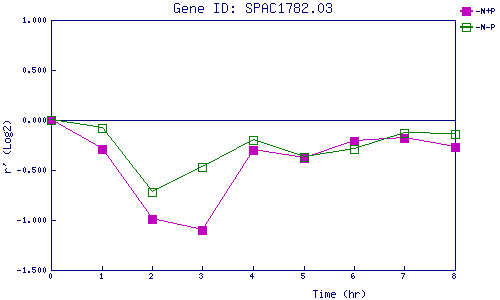
| -N+P | 0.000 | -0.287 | -0.992 | -1.100 | -0.297 | -0.375 | -0.209 | -0.182 | -0.274 |
| -N-P | 0.000 | -0.083 | -0.725 | -0.472 | -0.205 | -0.370 | -0.289 | -0.129 | -0.141 |
|
-N+P: Nitrogen starved in the presence of P-factor -N-P: Nitrogen starved in the absence of P-factor |