| 0 | 1 | 2 | 3 | 4 | 5 | 6 | 7 | 8 | |
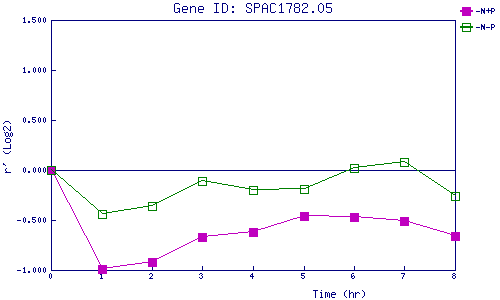
| -N+P | 0.000 | -0.986 | -0.917 | -0.674 | -0.623 | -0.461 | -0.469 | -0.506 | -0.662 |
| -N-P | 0.000 | -0.443 | -0.355 | -0.114 | -0.198 | -0.188 | 0.016 | 0.075 | -0.260 |
|
-N+P: Nitrogen starved in the presence of P-factor -N-P: Nitrogen starved in the absence of P-factor |