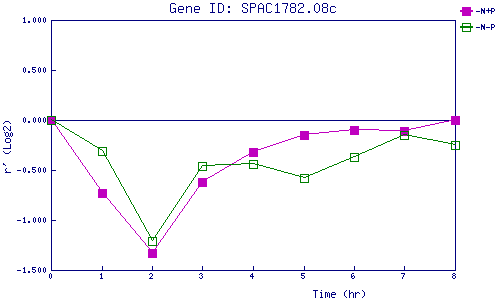
| 0 | 1 | 2 | 3 | 4 | 5 | 6 | 7 | 8 | |
| -N+P | 0.000 | -0.729 | -1.329 | -0.616 | -0.321 | -0.147 | -0.102 | -0.111 | -0.001 |
| -N-P | 0.000 | -0.312 | -1.208 | -0.461 | -0.442 | -0.579 | -0.367 | -0.152 | -0.247 |
|
-N+P: Nitrogen starved in the presence of P-factor -N-P: Nitrogen starved in the absence of P-factor |