flp1 clp1
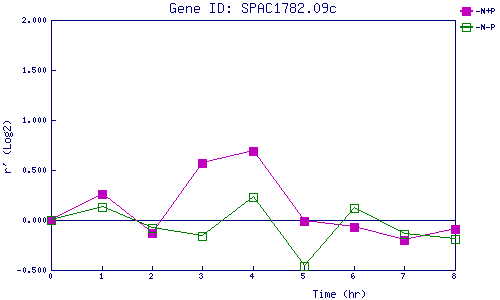
| 0 | 1 | 2 | 3 | 4 | 5 | 6 | 7 | 8 | |
| -N+P | 0.000 | 0.258 | -0.134 | 0.570 | 0.694 | -0.010 | -0.069 | -0.202 | -0.092 |
| -N-P | 0.000 | 0.127 | -0.078 | -0.162 | 0.230 | -0.458 | 0.117 | -0.137 | -0.194 |
|
-N+P: Nitrogen starved in the presence of P-factor -N-P: Nitrogen starved in the absence of P-factor |