nhp2
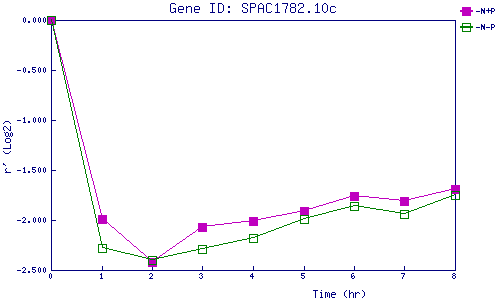
| 0 | 1 | 2 | 3 | 4 | 5 | 6 | 7 | 8 | |
| -N+P | 0.000 | -1.993 | -2.415 | -2.067 | -2.013 | -1.912 | -1.761 | -1.812 | -1.691 |
| -N-P | 0.000 | -2.283 | -2.403 | -2.286 | -2.178 | -1.991 | -1.860 | -1.941 | -1.747 |
|
-N+P: Nitrogen starved in the presence of P-factor -N-P: Nitrogen starved in the absence of P-factor |