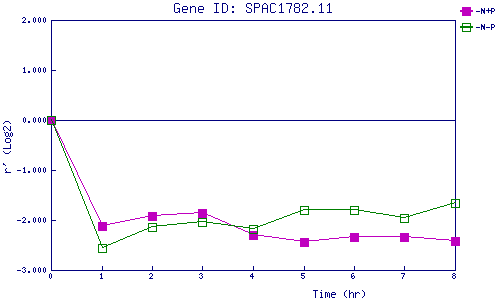
| 0 | 1 | 2 | 3 | 4 | 5 | 6 | 7 | 8 | |
| -N+P | 0.000 | -2.121 | -1.923 | -1.853 | -2.292 | -2.440 | -2.337 | -2.347 | -2.427 |
| -N-P | 0.000 | -2.565 | -2.147 | -2.034 | -2.174 | -1.808 | -1.790 | -1.953 | -1.651 |
|
-N+P: Nitrogen starved in the presence of P-factor -N-P: Nitrogen starved in the absence of P-factor |