hrp1 chd1
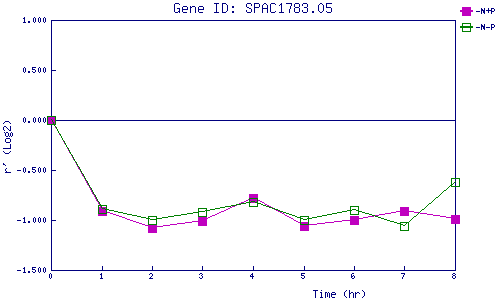
| 0 | 1 | 2 | 3 | 4 | 5 | 6 | 7 | 8 | |
| -N+P | 0.000 | -0.912 | -1.085 | -1.013 | -0.781 | -1.065 | -0.997 | -0.907 | -0.987 |
| -N-P | 0.000 | -0.887 | -0.996 | -0.924 | -0.817 | -1.003 | -0.903 | -1.057 | -0.618 |
|
-N+P: Nitrogen starved in the presence of P-factor -N-P: Nitrogen starved in the absence of P-factor |