rpl15-2 rpl1502
| 0 | 1 | 2 | 3 | 4 | 5 | 6 | 7 | 8 | |
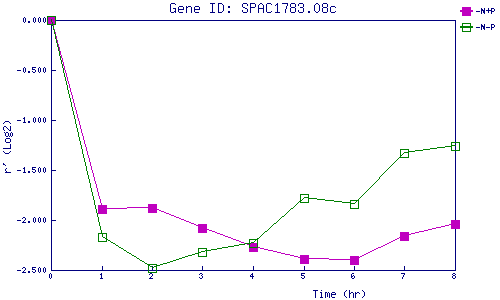
| -N+P | 0.000 | -1.893 | -1.881 | -2.085 | -2.271 | -2.390 | -2.400 | -2.159 | -2.046 |
| -N-P | 0.000 | -2.168 | -2.477 | -2.321 | -2.230 | -1.775 | -1.840 | -1.333 | -1.261 |
|
-N+P: Nitrogen starved in the presence of P-factor -N-P: Nitrogen starved in the absence of P-factor |