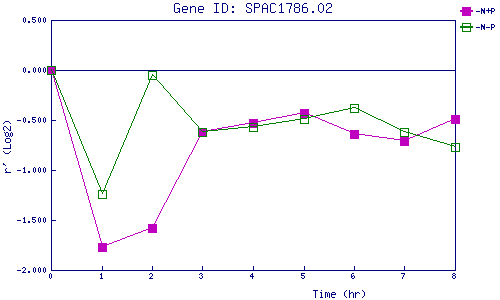
| 0 | 1 | 2 | 3 | 4 | 5 | 6 | 7 | 8 | |
| -N+P | 0.000 | -1.774 | -1.585 | -0.625 | -0.530 | -0.428 | -0.636 | -0.711 | -0.493 |
| -N-P | 0.000 | -1.239 | -0.050 | -0.622 | -0.566 | -0.492 | -0.384 | -0.623 | -0.773 |
|
-N+P: Nitrogen starved in the presence of P-factor -N-P: Nitrogen starved in the absence of P-factor |