vma6
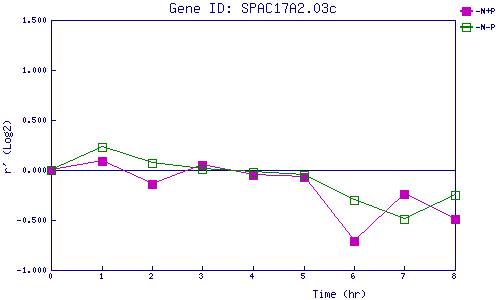
| 0 | 1 | 2 | 3 | 4 | 5 | 6 | 7 | 8 | |
| -N+P | 0.000 | 0.087 | -0.143 | 0.048 | -0.049 | -0.068 | -0.711 | -0.244 | -0.490 |
| -N-P | 0.000 | 0.230 | 0.069 | 0.012 | -0.016 | -0.048 | -0.300 | -0.493 | -0.252 |
|
-N+P: Nitrogen starved in the presence of P-factor -N-P: Nitrogen starved in the absence of P-factor |