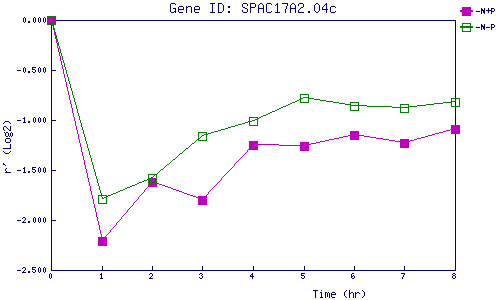
| 0 | 1 | 2 | 3 | 4 | 5 | 6 | 7 | 8 | |
| -N+P | 0.000 | -2.213 | -1.616 | -1.795 | -1.252 | -1.255 | -1.147 | -1.235 | -1.090 |
| -N-P | 0.000 | -1.786 | -1.585 | -1.165 | -1.011 | -0.775 | -0.863 | -0.885 | -0.821 |
|
-N+P: Nitrogen starved in the presence of P-factor -N-P: Nitrogen starved in the absence of P-factor |