| 0 | 1 | 2 | 3 | 4 | 5 | 6 | 7 | 8 | |
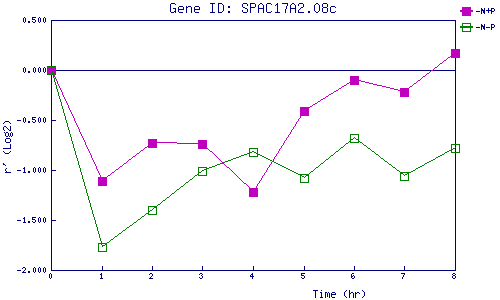
| -N+P | 0.000 | -1.112 | -0.734 | -0.740 | -1.215 | -0.412 | -0.095 | -0.217 | 0.171 |
| -N-P | 0.000 | -1.768 | -1.405 | -1.006 | -0.824 | -1.084 | -0.678 | -1.057 | -0.780 |
|
-N+P: Nitrogen starved in the presence of P-factor -N-P: Nitrogen starved in the absence of P-factor |