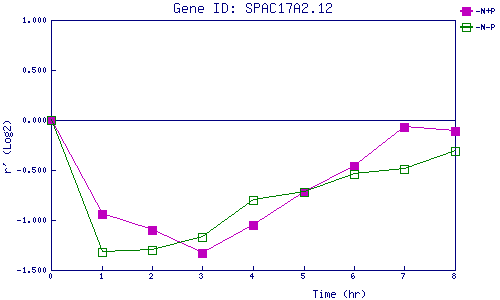
| 0 | 1 | 2 | 3 | 4 | 5 | 6 | 7 | 8 | |
| -N+P | 0.000 | -0.939 | -1.099 | -1.332 | -1.053 | -0.718 | -0.462 | -0.072 | -0.112 |
| -N-P | 0.000 | -1.324 | -1.305 | -1.173 | -0.798 | -0.718 | -0.544 | -0.486 | -0.313 |
|
-N+P: Nitrogen starved in the presence of P-factor -N-P: Nitrogen starved in the absence of P-factor |