dbr1 rpl301 rpl301
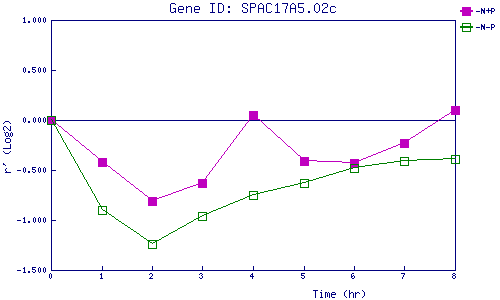
| 0 | 1 | 2 | 3 | 4 | 5 | 6 | 7 | 8 | |
| -N+P | 0.000 | -0.424 | -0.814 | -0.634 | 0.048 | -0.410 | -0.432 | -0.234 | 0.099 |
| -N-P | 0.000 | -0.904 | -1.243 | -0.963 | -0.748 | -0.633 | -0.476 | -0.411 | -0.391 |
|
-N+P: Nitrogen starved in the presence of P-factor -N-P: Nitrogen starved in the absence of P-factor |