rpl3-1 rpl301 rpl3
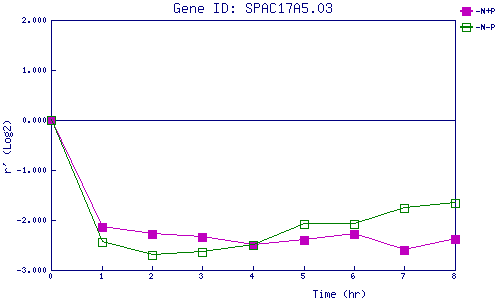
| 0 | 1 | 2 | 3 | 4 | 5 | 6 | 7 | 8 | |
| -N+P | 0.000 | -2.136 | -2.279 | -2.341 | -2.506 | -2.392 | -2.285 | -2.611 | -2.389 |
| -N-P | 0.000 | -2.433 | -2.707 | -2.646 | -2.502 | -2.089 | -2.085 | -1.752 | -1.663 |
|
-N+P: Nitrogen starved in the presence of P-factor -N-P: Nitrogen starved in the absence of P-factor |