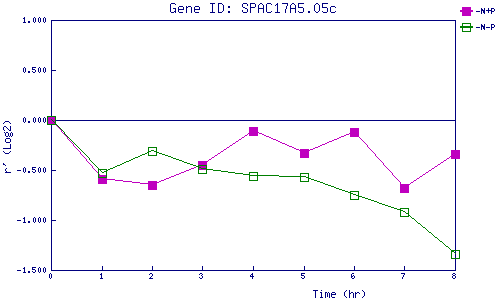
| 0 | 1 | 2 | 3 | 4 | 5 | 6 | 7 | 8 | |
| -N+P | 0.000 | -0.591 | -0.650 | -0.454 | -0.110 | -0.327 | -0.124 | -0.681 | -0.339 |
| -N-P | 0.000 | -0.528 | -0.313 | -0.490 | -0.558 | -0.572 | -0.748 | -0.918 | -1.340 |
|
-N+P: Nitrogen starved in the presence of P-factor -N-P: Nitrogen starved in the absence of P-factor |