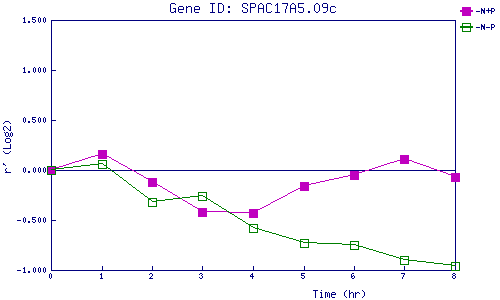
| 0 | 1 | 2 | 3 | 4 | 5 | 6 | 7 | 8 | |
| -N+P | 0.000 | 0.163 | -0.124 | -0.421 | -0.432 | -0.160 | -0.054 | 0.107 | -0.067 |
| -N-P | 0.000 | 0.064 | -0.321 | -0.265 | -0.583 | -0.726 | -0.750 | -0.901 | -0.955 |
|
-N+P: Nitrogen starved in the presence of P-factor -N-P: Nitrogen starved in the absence of P-factor |