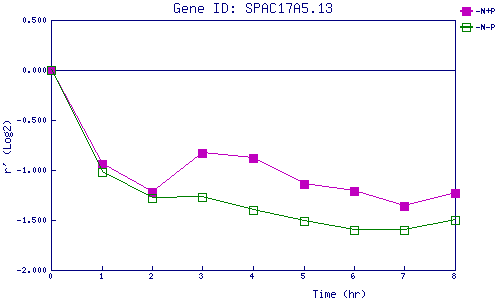
| 0 | 1 | 2 | 3 | 4 | 5 | 6 | 7 | 8 | |
| -N+P | 0.000 | -0.935 | -1.221 | -0.827 | -0.878 | -1.140 | -1.208 | -1.357 | -1.228 |
| -N-P | 0.000 | -1.021 | -1.281 | -1.271 | -1.398 | -1.508 | -1.600 | -1.605 | -1.496 |
|
-N+P: Nitrogen starved in the presence of P-factor -N-P: Nitrogen starved in the absence of P-factor |