tif471
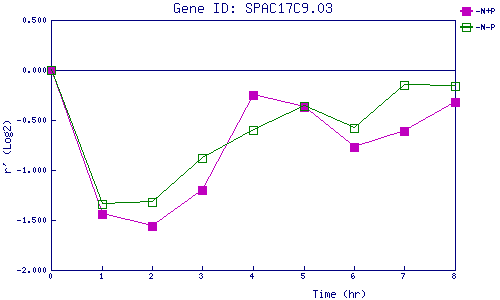
| 0 | 1 | 2 | 3 | 4 | 5 | 6 | 7 | 8 | |
| -N+P | 0.000 | -1.443 | -1.563 | -1.199 | -0.249 | -0.370 | -0.767 | -0.606 | -0.323 |
| -N-P | 0.000 | -1.336 | -1.320 | -0.882 | -0.602 | -0.358 | -0.584 | -0.148 | -0.162 |
|
-N+P: Nitrogen starved in the presence of P-factor -N-P: Nitrogen starved in the absence of P-factor |