tim13
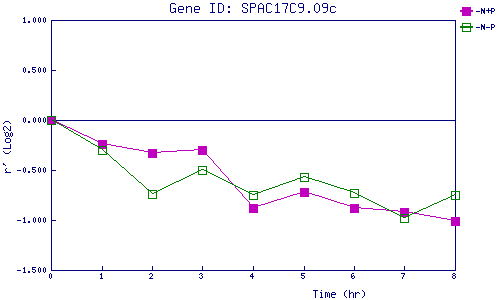
| 0 | 1 | 2 | 3 | 4 | 5 | 6 | 7 | 8 | |
| -N+P | 0.000 | -0.245 | -0.327 | -0.299 | -0.883 | -0.716 | -0.882 | -0.923 | -1.011 |
| -N-P | 0.000 | -0.298 | -0.741 | -0.505 | -0.747 | -0.571 | -0.733 | -0.980 | -0.746 |
|
-N+P: Nitrogen starved in the presence of P-factor -N-P: Nitrogen starved in the absence of P-factor |