cut8
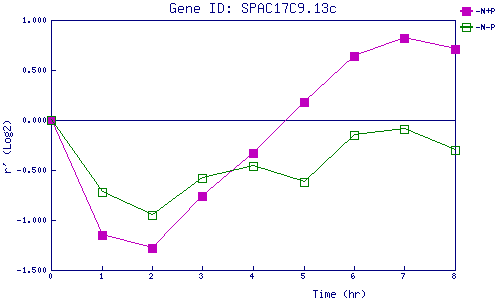
| 0 | 1 | 2 | 3 | 4 | 5 | 6 | 7 | 8 | |
| -N+P | 0.000 | -1.152 | -1.284 | -0.761 | -0.328 | 0.182 | 0.637 | 0.821 | 0.714 |
| -N-P | 0.000 | -0.715 | -0.948 | -0.578 | -0.462 | -0.625 | -0.154 | -0.090 | -0.298 |
|
-N+P: Nitrogen starved in the presence of P-factor -N-P: Nitrogen starved in the absence of P-factor |