| 0 | 1 | 2 | 3 | 4 | 5 | 6 | 7 | 8 | |
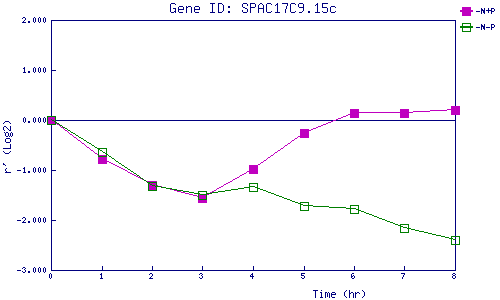
| -N+P | 0.000 | -0.776 | -1.305 | -1.566 | -0.976 | -0.264 | 0.142 | 0.134 | 0.197 |
| -N-P | 0.000 | -0.643 | -1.328 | -1.499 | -1.334 | -1.731 | -1.775 | -2.151 | -2.390 |
|
-N+P: Nitrogen starved in the presence of P-factor -N-P: Nitrogen starved in the absence of P-factor |