sna41 goa1
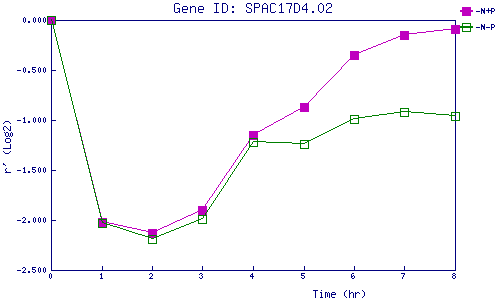
| 0 | 1 | 2 | 3 | 4 | 5 | 6 | 7 | 8 | |
| -N+P | 0.000 | -2.018 | -2.128 | -1.895 | -1.146 | -0.871 | -0.347 | -0.149 | -0.094 |
| -N-P | 0.000 | -2.027 | -2.190 | -1.991 | -1.215 | -1.245 | -0.991 | -0.924 | -0.961 |
|
-N+P: Nitrogen starved in the presence of P-factor -N-P: Nitrogen starved in the absence of P-factor |