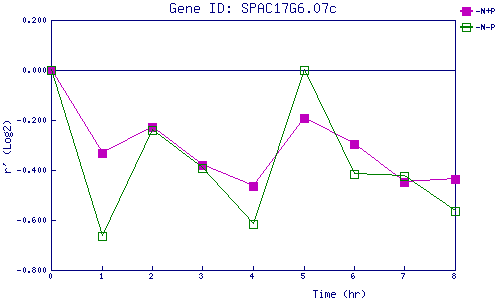
| 0 | 1 | 2 | 3 | 4 | 5 | 6 | 7 | 8 | |
| -N+P | 0.000 | -0.333 | -0.229 | -0.380 | -0.464 | -0.194 | -0.295 | -0.447 | -0.435 |
| -N-P | 0.000 | -0.665 | -0.238 | -0.392 | -0.618 | 0.000 | -0.414 | -0.426 | -0.563 |
|
-N+P: Nitrogen starved in the presence of P-factor -N-P: Nitrogen starved in the absence of P-factor |