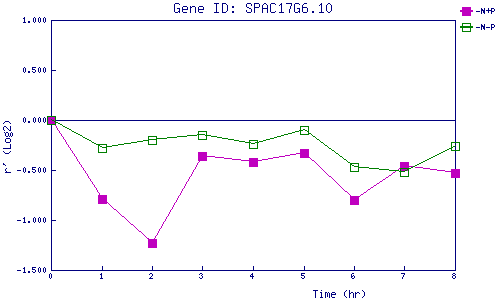
| 0 | 1 | 2 | 3 | 4 | 5 | 6 | 7 | 8 | |
| -N+P | 0.000 | -0.788 | -1.232 | -0.362 | -0.423 | -0.328 | -0.803 | -0.460 | -0.534 |
| -N-P | 0.000 | -0.275 | -0.196 | -0.154 | -0.243 | -0.103 | -0.470 | -0.525 | -0.264 |
|
-N+P: Nitrogen starved in the presence of P-factor -N-P: Nitrogen starved in the absence of P-factor |