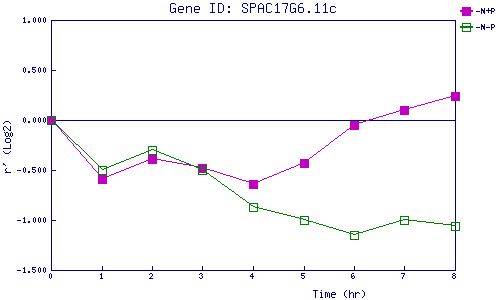
| 0 | 1 | 2 | 3 | 4 | 5 | 6 | 7 | 8 | |
| -N+P | 0.000 | -0.594 | -0.387 | -0.481 | -0.645 | -0.433 | -0.048 | 0.100 | 0.245 |
| -N-P | 0.000 | -0.503 | -0.304 | -0.503 | -0.868 | -1.001 | -1.147 | -1.001 | -1.058 |
|
-N+P: Nitrogen starved in the presence of P-factor -N-P: Nitrogen starved in the absence of P-factor |