uap56
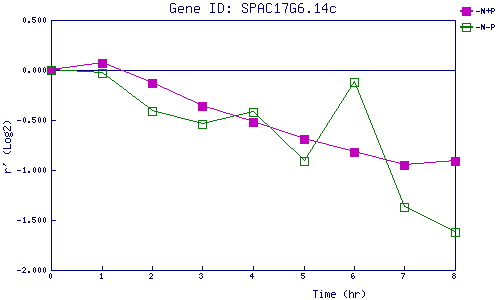
| 0 | 1 | 2 | 3 | 4 | 5 | 6 | 7 | 8 | |
| -N+P | 0.000 | 0.069 | -0.128 | -0.365 | -0.523 | -0.690 | -0.821 | -0.952 | -0.907 |
| -N-P | 0.000 | -0.027 | -0.414 | -0.545 | -0.420 | -0.911 | -0.125 | -1.369 | -1.622 |
|
-N+P: Nitrogen starved in the presence of P-factor -N-P: Nitrogen starved in the absence of P-factor |