| 0 | 1 | 2 | 3 | 4 | 5 | 6 | 7 | 8 | |
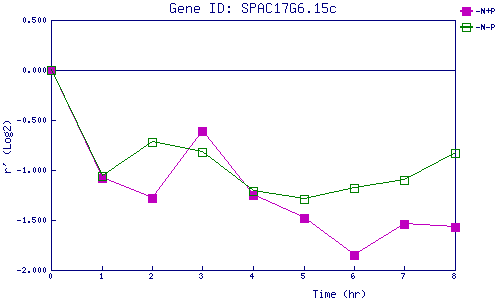
| -N+P | 0.000 | -1.082 | -1.284 | -0.606 | -1.254 | -1.476 | -1.853 | -1.545 | -1.570 |
| -N-P | 0.000 | -1.060 | -0.717 | -0.823 | -1.211 | -1.294 | -1.183 | -1.101 | -0.834 |
|
-N+P: Nitrogen starved in the presence of P-factor -N-P: Nitrogen starved in the absence of P-factor |