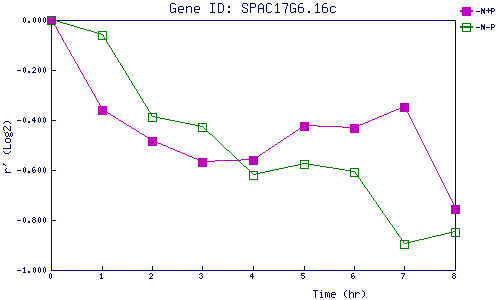
| 0 | 1 | 2 | 3 | 4 | 5 | 6 | 7 | 8 | |
| -N+P | 0.000 | -0.358 | -0.484 | -0.570 | -0.559 | -0.424 | -0.432 | -0.349 | -0.755 |
| -N-P | 0.000 | -0.059 | -0.389 | -0.428 | -0.620 | -0.577 | -0.606 | -0.895 | -0.848 |
|
-N+P: Nitrogen starved in the presence of P-factor -N-P: Nitrogen starved in the absence of P-factor |