pof8
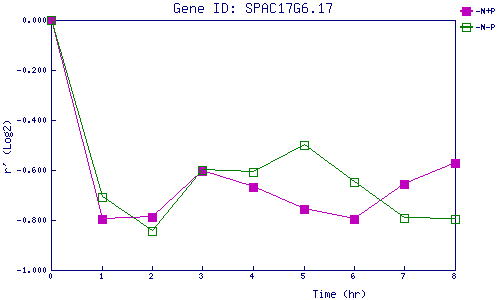
| 0 | 1 | 2 | 3 | 4 | 5 | 6 | 7 | 8 | |
| -N+P | 0.000 | -0.795 | -0.788 | -0.604 | -0.669 | -0.755 | -0.796 | -0.654 | -0.573 |
| -N-P | 0.000 | -0.707 | -0.845 | -0.598 | -0.606 | -0.500 | -0.649 | -0.790 | -0.796 |
|
-N+P: Nitrogen starved in the presence of P-factor -N-P: Nitrogen starved in the absence of P-factor |