| 0 | 1 | 2 | 3 | 4 | 5 | 6 | 7 | 8 | |
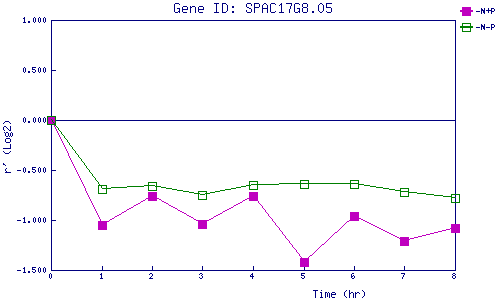
| -N+P | 0.000 | -1.053 | -0.757 | -1.044 | -0.761 | -1.415 | -0.955 | -1.208 | -1.075 |
| -N-P | 0.000 | -0.689 | -0.664 | -0.749 | -0.651 | -0.638 | -0.639 | -0.725 | -0.782 |
|
-N+P: Nitrogen starved in the presence of P-factor -N-P: Nitrogen starved in the absence of P-factor |