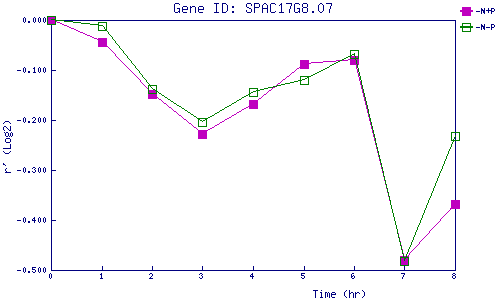
| 0 | 1 | 2 | 3 | 4 | 5 | 6 | 7 | 8 | |
| -N+P | 0.000 | -0.045 | -0.148 | -0.229 | -0.167 | -0.089 | -0.079 | -0.481 | -0.369 |
| -N-P | 0.000 | -0.011 | -0.138 | -0.205 | -0.145 | -0.120 | -0.069 | -0.482 | -0.232 |
|
-N+P: Nitrogen starved in the presence of P-factor -N-P: Nitrogen starved in the absence of P-factor |