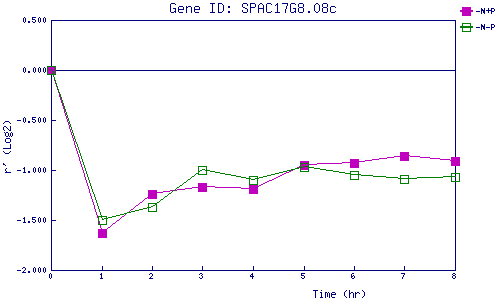
| 0 | 1 | 2 | 3 | 4 | 5 | 6 | 7 | 8 | |
| -N+P | 0.000 | -1.631 | -1.237 | -1.172 | -1.193 | -0.954 | -0.933 | -0.858 | -0.913 |
| -N-P | 0.000 | -1.501 | -1.370 | -1.005 | -1.095 | -0.970 | -1.050 | -1.087 | -1.074 |
|
-N+P: Nitrogen starved in the presence of P-factor -N-P: Nitrogen starved in the absence of P-factor |