shg1
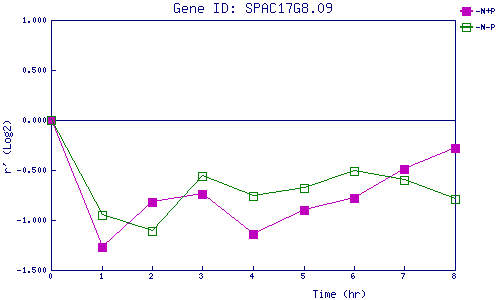
| 0 | 1 | 2 | 3 | 4 | 5 | 6 | 7 | 8 | |
| -N+P | 0.000 | -1.266 | -0.816 | -0.739 | -1.142 | -0.897 | -0.776 | -0.488 | -0.283 |
| -N-P | 0.000 | -0.946 | -1.108 | -0.560 | -0.760 | -0.675 | -0.508 | -0.595 | -0.793 |
|
-N+P: Nitrogen starved in the presence of P-factor -N-P: Nitrogen starved in the absence of P-factor |