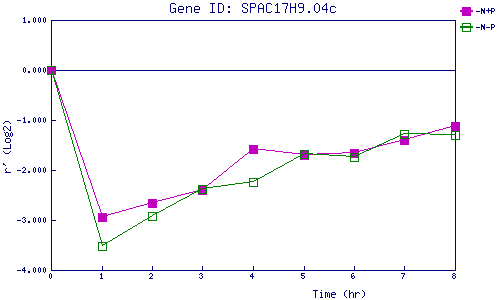
| 0 | 1 | 2 | 3 | 4 | 5 | 6 | 7 | 8 | |
| -N+P | 0.000 | -2.934 | -2.655 | -2.408 | -1.576 | -1.695 | -1.665 | -1.396 | -1.118 |
| -N-P | 0.000 | -3.527 | -2.927 | -2.375 | -2.231 | -1.681 | -1.749 | -1.284 | -1.295 |
|
-N+P: Nitrogen starved in the presence of P-factor -N-P: Nitrogen starved in the absence of P-factor |