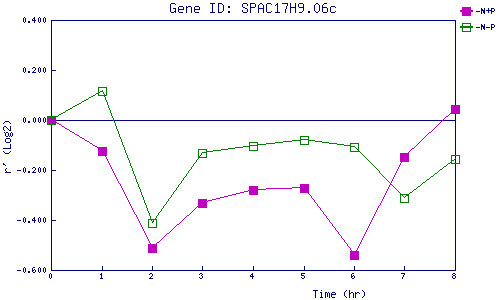
| 0 | 1 | 2 | 3 | 4 | 5 | 6 | 7 | 8 | |
| -N+P | 0.000 | -0.123 | -0.514 | -0.332 | -0.280 | -0.270 | -0.539 | -0.147 | 0.043 |
| -N-P | 0.000 | 0.116 | -0.412 | -0.133 | -0.104 | -0.080 | -0.109 | -0.314 | -0.155 |
|
-N+P: Nitrogen starved in the presence of P-factor -N-P: Nitrogen starved in the absence of P-factor |