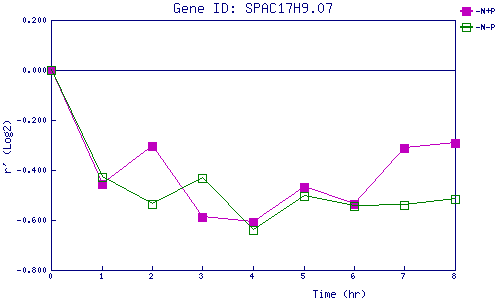
| 0 | 1 | 2 | 3 | 4 | 5 | 6 | 7 | 8 | |
| -N+P | 0.000 | -0.458 | -0.303 | -0.588 | -0.609 | -0.469 | -0.534 | -0.314 | -0.291 |
| -N-P | 0.000 | -0.428 | -0.538 | -0.434 | -0.639 | -0.503 | -0.542 | -0.541 | -0.517 |
|
-N+P: Nitrogen starved in the presence of P-factor -N-P: Nitrogen starved in the absence of P-factor |