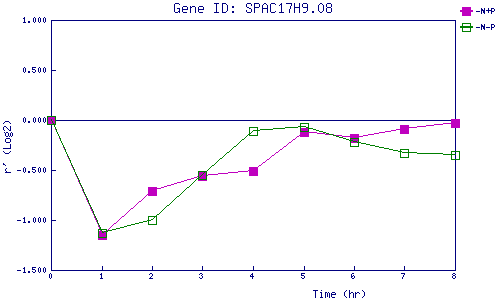
| 0 | 1 | 2 | 3 | 4 | 5 | 6 | 7 | 8 | |
| -N+P | 0.000 | -1.153 | -0.706 | -0.560 | -0.507 | -0.121 | -0.176 | -0.092 | -0.029 |
| -N-P | 0.000 | -1.130 | -0.998 | -0.553 | -0.114 | -0.072 | -0.215 | -0.327 | -0.350 |
|
-N+P: Nitrogen starved in the presence of P-factor -N-P: Nitrogen starved in the absence of P-factor |