ras1 ste5
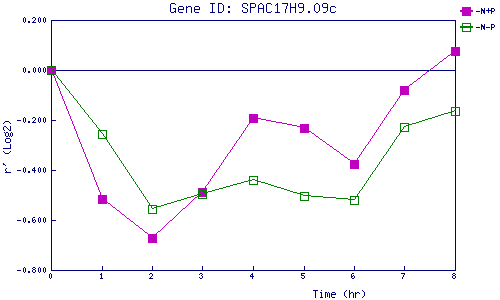
| 0 | 1 | 2 | 3 | 4 | 5 | 6 | 7 | 8 | |
| -N+P | 0.000 | -0.515 | -0.672 | -0.490 | -0.192 | -0.232 | -0.374 | -0.080 | 0.076 |
| -N-P | 0.000 | -0.254 | -0.556 | -0.496 | -0.441 | -0.505 | -0.520 | -0.229 | -0.164 |
|
-N+P: Nitrogen starved in the presence of P-factor -N-P: Nitrogen starved in the absence of P-factor |