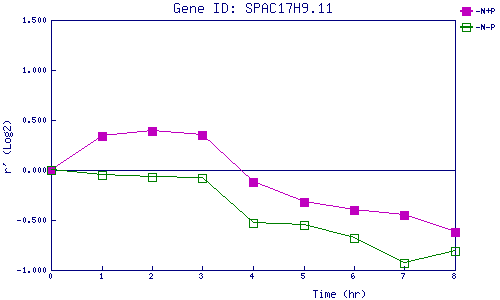
| 0 | 1 | 2 | 3 | 4 | 5 | 6 | 7 | 8 | |
| -N+P | 0.000 | 0.338 | 0.393 | 0.347 | -0.117 | -0.322 | -0.395 | -0.447 | -0.619 |
| -N-P | 0.000 | -0.049 | -0.067 | -0.081 | -0.526 | -0.548 | -0.680 | -0.932 | -0.808 |
|
-N+P: Nitrogen starved in the presence of P-factor -N-P: Nitrogen starved in the absence of P-factor |