tom22
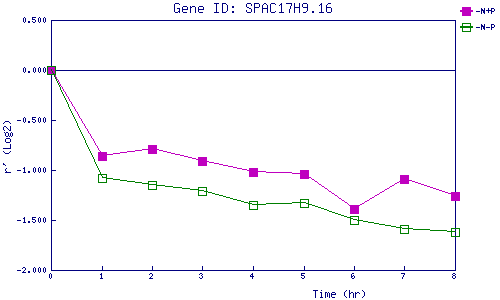
| 0 | 1 | 2 | 3 | 4 | 5 | 6 | 7 | 8 | |
| -N+P | 0.000 | -0.862 | -0.786 | -0.908 | -1.017 | -1.043 | -1.387 | -1.088 | -1.257 |
| -N-P | 0.000 | -1.082 | -1.154 | -1.214 | -1.350 | -1.334 | -1.496 | -1.589 | -1.617 |
|
-N+P: Nitrogen starved in the presence of P-factor -N-P: Nitrogen starved in the absence of P-factor |